Mastering NetScaler Console: Zero to hero in 31days - Day 16 - Web Transaction Analytics
Web transaction(s), you would hope there was more than one...
Carole-Anne runs a fashion brand based in Paris (of course) but has outlets globally. All the best-dressed people in the world love her designs. The autumn collection was a massive hit and has driven a surge in traffic to her website, keeping up with demand is a priority. World domination is within her grasp!
Suddenly there is a drop in revenue from her online shop. One of her colleagues looks at the site and sees some ‘slowness’.
Noooooooooooooooo!!!!!!!!!!!!!!!!!!!!
A backend issue that wasn’t spotted, it takes seconds to resolve, but the revenue lost is significant. World domination might need to wait a bit….
Who am I?
Hello, my name is Andrew, and I tend to get a lot of questions about NetScaler Console. This post is one of a series to offer some pointers on what it is, what it can offer, and why you should take some notice. This is the sixteenth and a bit post in a set which is designed to cover the top topics that will get you trained up.
Knowledge is power, right? 📖
31 days seems an arbitrary number. Today is all about NetScaler Console Web Transactions Analytics.
How does this normally come up?
When a customer has NetScaler running in their infrastructure, one of the popular use cases is to have it front some sort of website.
Why would they do that?
Having NetScaler in front of web servers has a number of instant benefits.
SSL/TLS offload performance. This saves the web servers from having to do some heavy lifting, the result is that with the same number of web servers, you can handle more connections. Alternatively, you can scale back the number of web servers for a given load.
Connection multiplexing. This is similar to the first point, the NetScaler maintains a fewer number of back-end connections, lightening the load on the web tier.
Caching. NetScaler can cache content, so it serves it from memory rather than ask the web server for popular material, this improves scaling and response time.
Compression. This is somewhat content-specific, but if it is possible to squeeze the content a bit, it will also help with the page load time.
Assuming one of those applies, the next stage is to work out how the site is performing/behaving for the users. Getting Console to provide the specifics is very handy.
Who would be interested in this?
Any Network Admin, who needs to have his/her finger on the pulse of the website that they are hosting will be facing increasing time pressures. How can they get some time back and become a superhero?
I know - shoot for the stars!
Mastering sounds 'heavy'?
Ultimately, this is Substack, who would be crazy enough to write technical content on this platform?
What can NetScaler Console let you see?
When you have a website, you need to know when:
Response time > 500 ms
5xx errors
Response time is an obvious problem, half a second is a lifetime online! A 500 Error means something went wrong on the server while processing the request. Common causes include server misconfigurations, application bugs, resource limits, or database issues. Check server logs or debug code to identify and fix the problem. Also, it is possible to see a few sample 2xx transactions for the selected applications. A 2xx status code indicates a successful request.
How to setup
To turn it on. Got to: Settings > Analytics Settings, select Enable Features for Analytics, and select All. As shown here.
What does it look like?
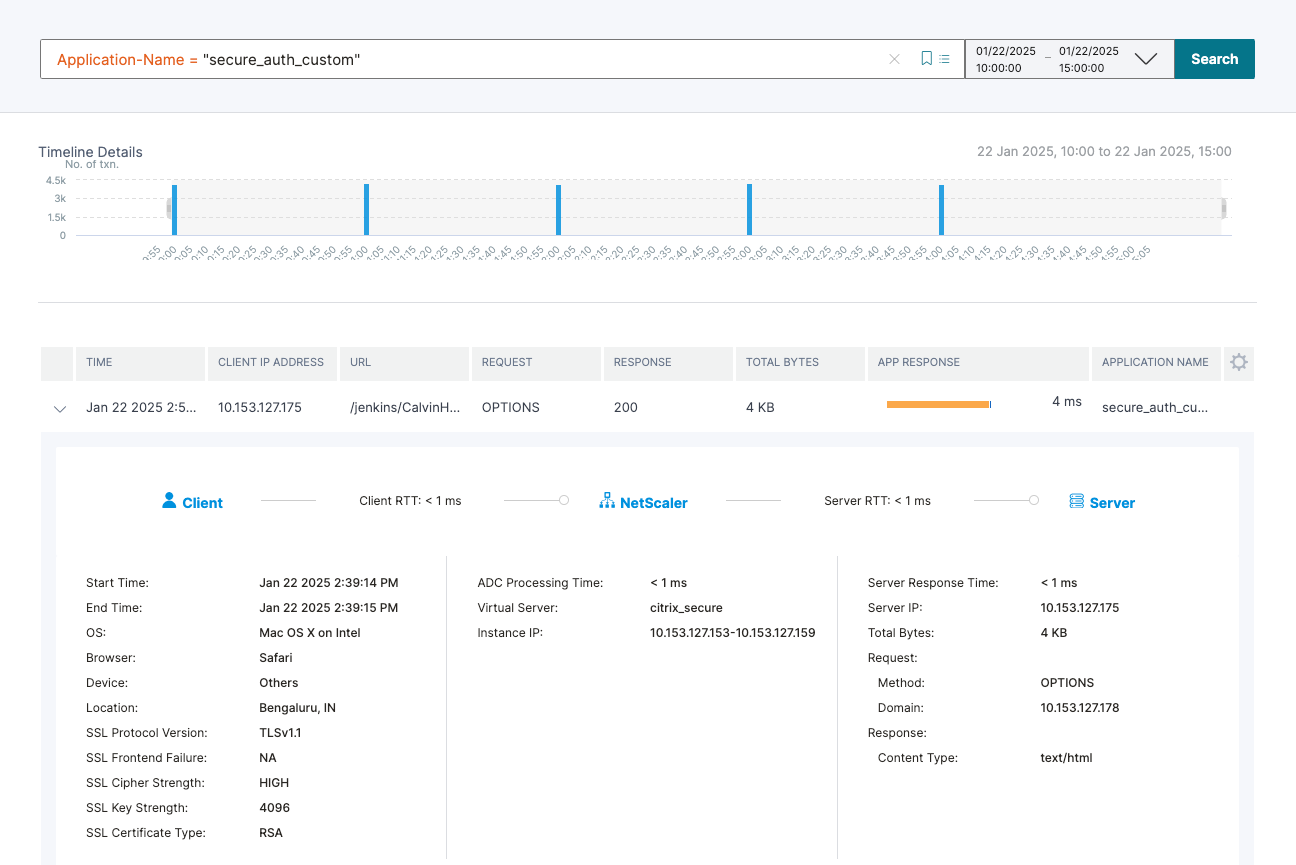
In this case, here is an application with some issues. This was sourced from the App dashboard. The score for this app is showing up as 58%, so not that healthy. The details can be viewed in the ‘Transaction logs’.
There is an option to refine the time index and take a look at exactly what is happening with a transaction.
It breaks out the client connection in some detail. Floating the mouse over the ‘App response’ breaks out the response time quickly without the need to change the view.
What else then?
The view can also be filtered to take a look at specific types of events. 403 (denied access) or 404 (not found). There seem quite a few in this sample!
I don’t read so well, give me a movie!
You got this far, impressive stuff. Here is Sanyukta covering the topic too. Thanks Sanyukta!
The Call to Action
Let me know if this piece raises any questions/comments, drop them into the space below. I will endeavor to answer directly or update the post to better address the question(s).
Summary
Buckle up. The NetScaler Console is the best tool for many different jobs when working in conjunction with the NetScaler Appliance. They are the perfect tag team. 🤼. The NetScaler Console can offer a one-stop shop to see all your appliances from one place, deploy and update them, and track those applications and the level of Security in place that your business needs.
Web transactions are a key resource when looking at site performance. NetScaler Console has your back!
Let me show you how to make the most of it!
Have a good one.


