
30 Days of ADM: Day 16 October 21, 2022
Network reporting and automation, a superpower!

I am back, it is day 16.
I know what you are thinking.
Why do I need an external tool to tell me what is going on? The NetScaler has a built-in dashboard that tells me what is happening now. It is good enough.
Or is it?
Ok, so you have two appliances. What will you do? Now run two tabs in the browser, that works!
What about 30 appliances?
You have been selected for a training course in Citrix ADM, the goal is to provide you with enough information to be actually dangerous when talking to a customer or client. 30 days is a bit of an arbitrary number, but I am prepared to give you 2minutes of material, can I get 2 minutes of your time?
I have talked about Fleet management, general analytics, security analytics, AI / ML, Stylebooks, Pooled Capacity, instance advisory upgrade, security advisory, Autoscaling, onboarding, RESTful API, CADS self-managed, Service Graph, Web Transaction Analytics and config Jobs
Today is all about Network Reporting
Honestly, what are you talking about?
When you need to get some reports to show the status across the NetScaler estate, ADM offers the option to have a custom report that can look across all yourappliances. One report for however many boxes you have.
So what? What problem does it solve?
The Dashboard on the appliance is useful but just shows you what is happening on that appliance, another browser tab could let you view two of those dashboards butthis option doesn’t really scale very well.
In the reporting module, you can choose the instances you need for that. The other side of this is it can be useful to wind the clock back and run this fora specific time period.
Who would be interested in this?
Almost any customer uses one or more NetScaler within their infrastructure. That’s everyone, right?
Let me have an example of its use.
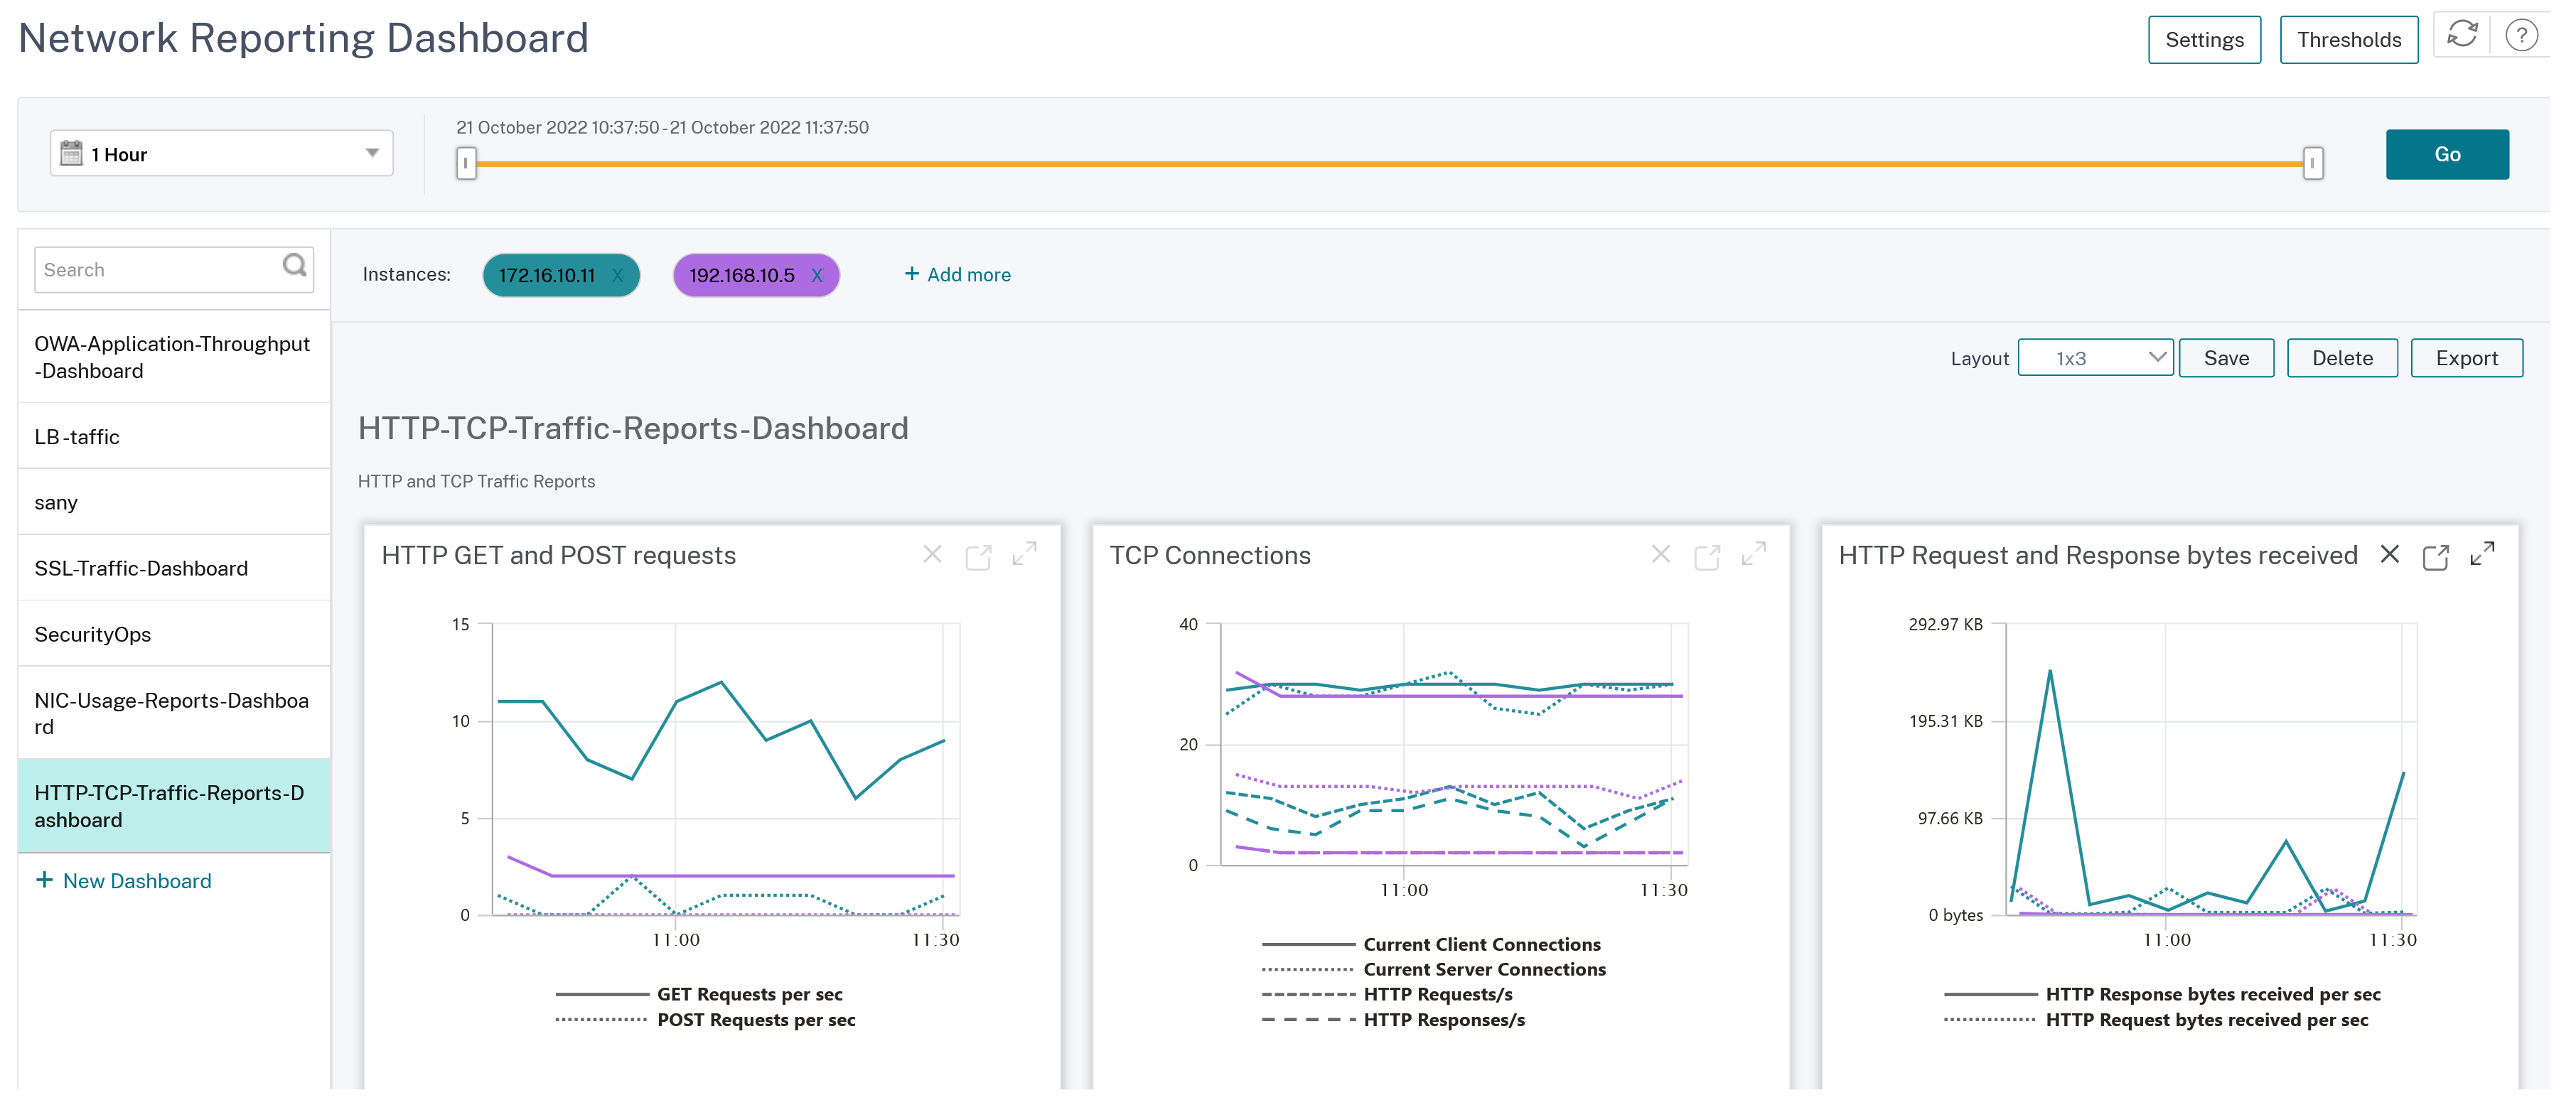
In this case you need to have three parameters on a report from two different NetScaler appliances.
· HTTP-TCP and POST requests
· TCP Connections
· HTTP Request and Response bytes
The time interval has been set as a one hour duration for a time slot on the 10th October at 10.26.29 up to 11.26.29. A pretty specific time slot.
Ok, what else?
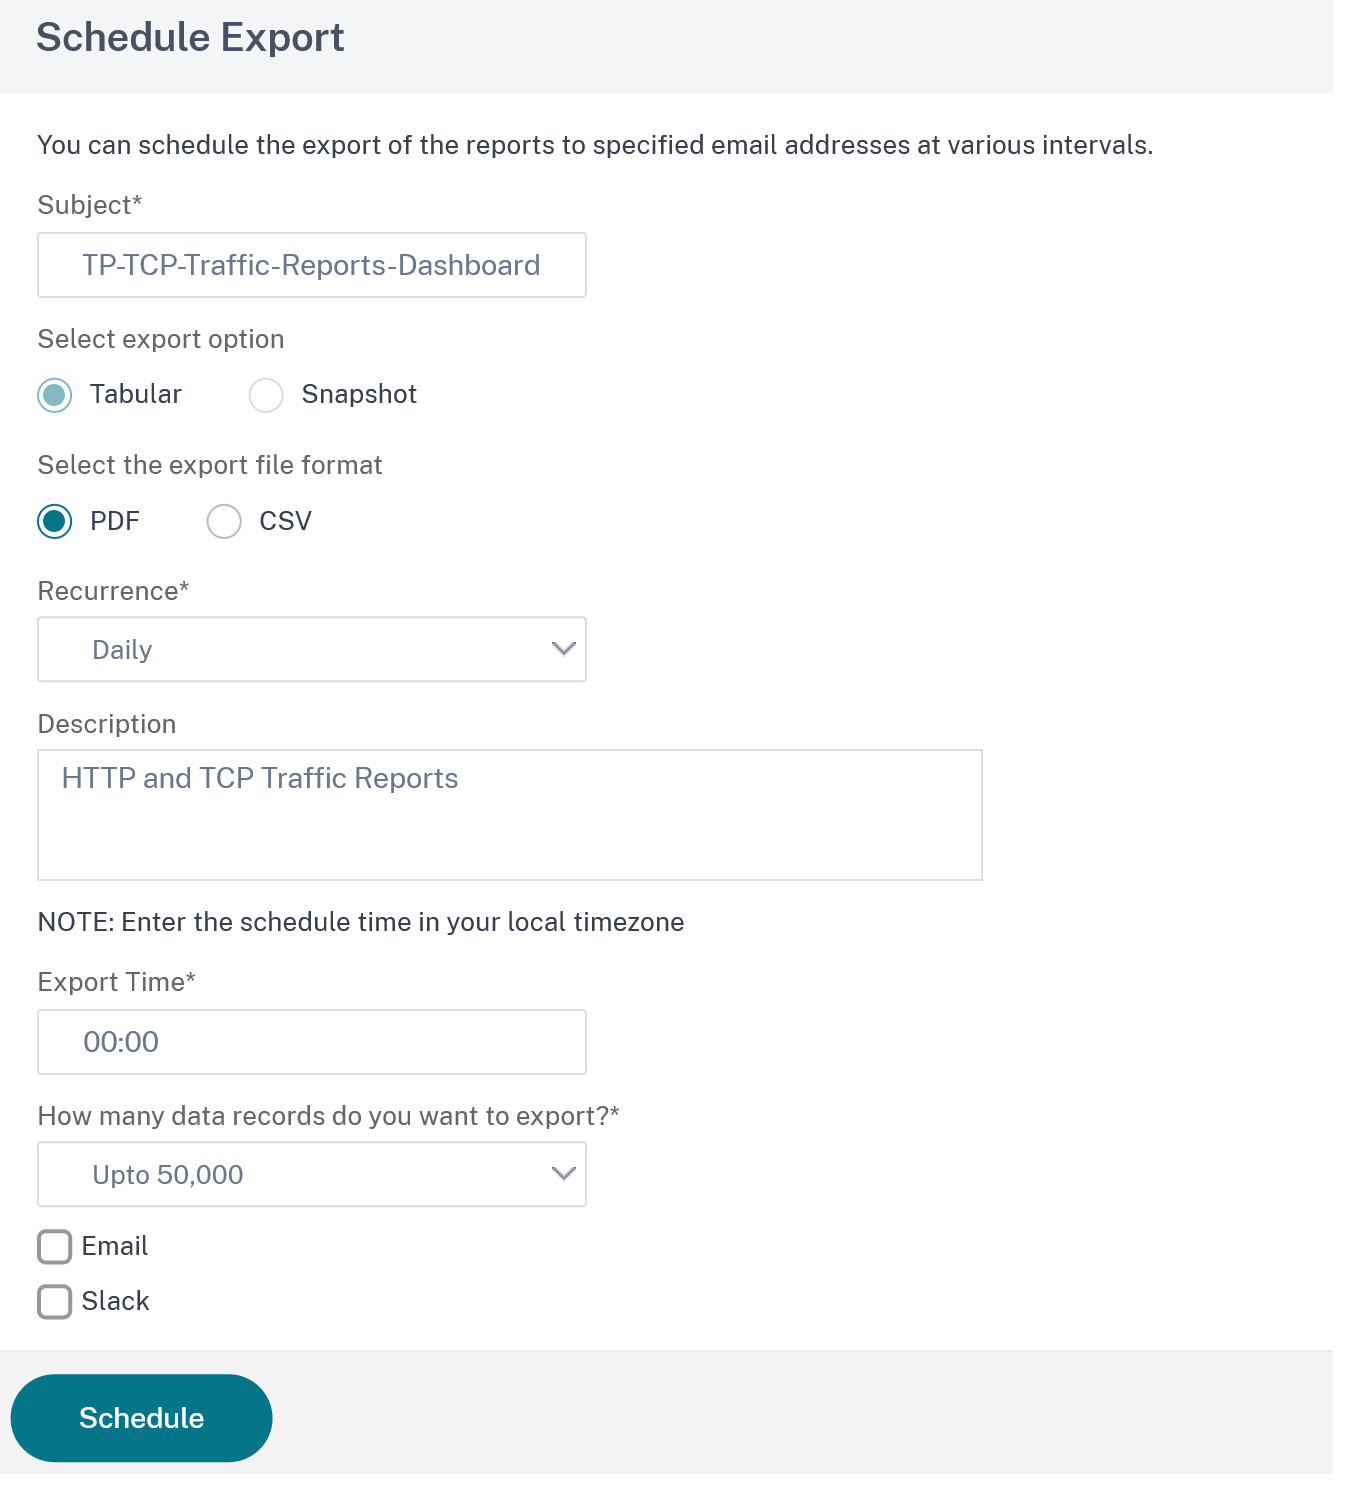
When a report has been defined, can I export it?
Of course, a report can be exported in PDF, JPEG, PNG, or CSV formats. It can also be set up to push out the report everyday at a set time. This allows you to send the Ops guys the details of your service at a defined interval.
Ok, what else?
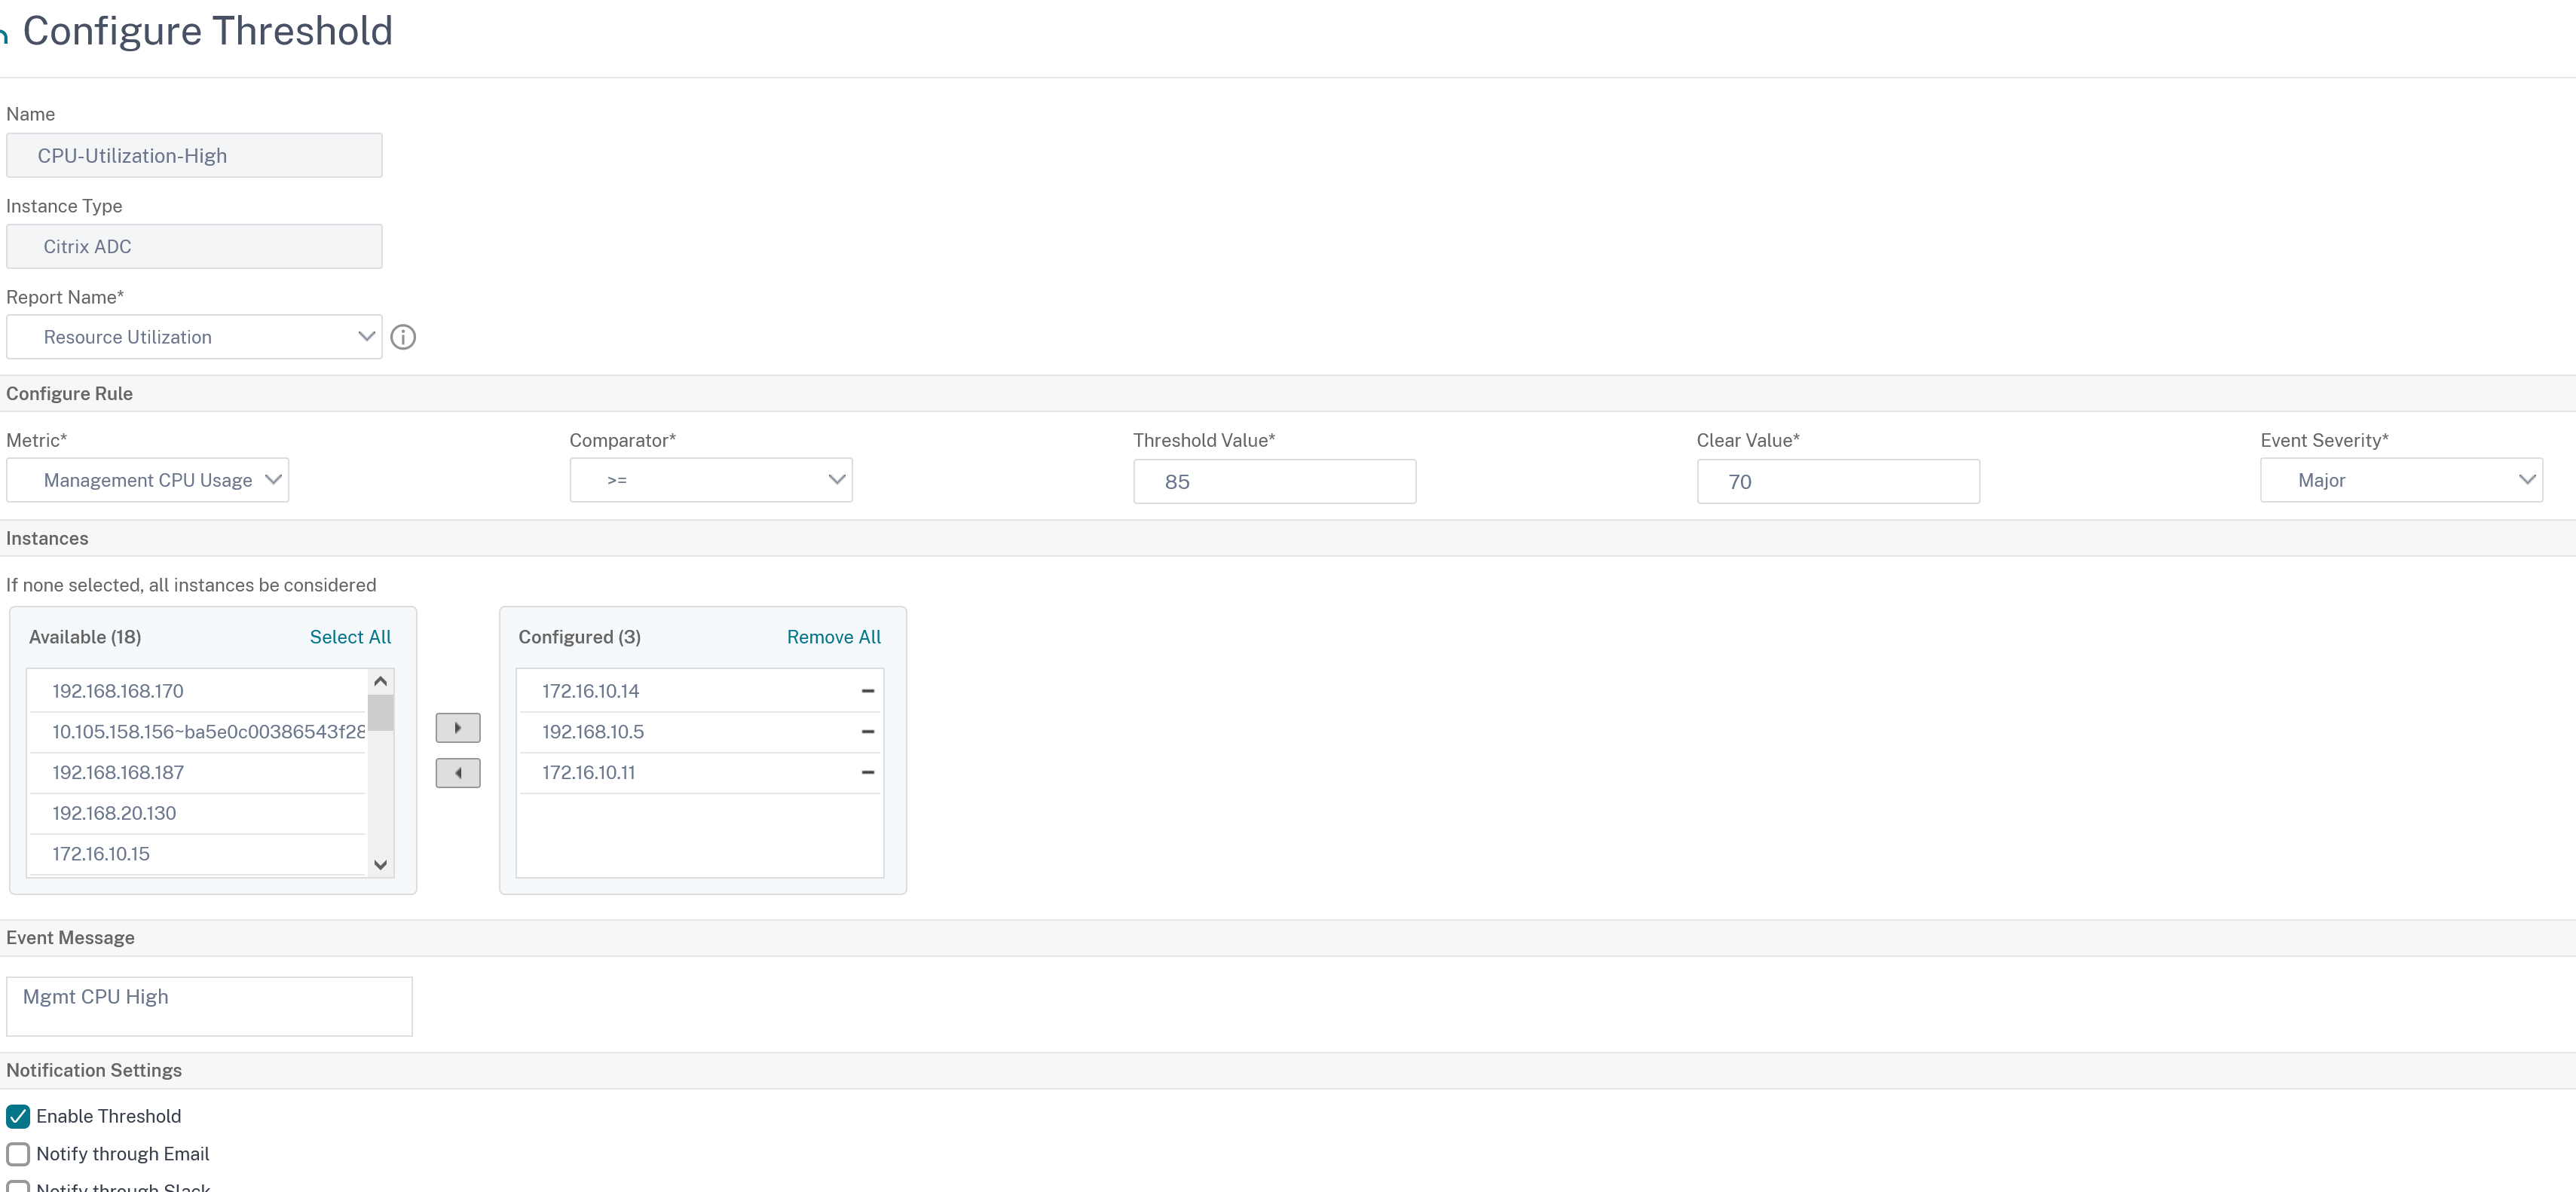
You can also define a threshold and have an action trigger a report based on a condition. In this case the report is looking at Management CPU utilization. Pretty cool.
Summary.
Having a way to get a Network Report is a great option. You get the ability to manage your infrastructure and set up some automation to help you stay on top of your environment. With tools like this, you can save time and ensure that you get back to high-value tasks.
Ultimately, it is another killer feature that is enabled with ADM service.
It is free too.
What’s not to like?